Website analytics
The Website analytics page (from Website, click the Analytics card, or go to /website/analytics) shows how visitors are using your public booking site.
Filtering
At the top you can narrow the data with:
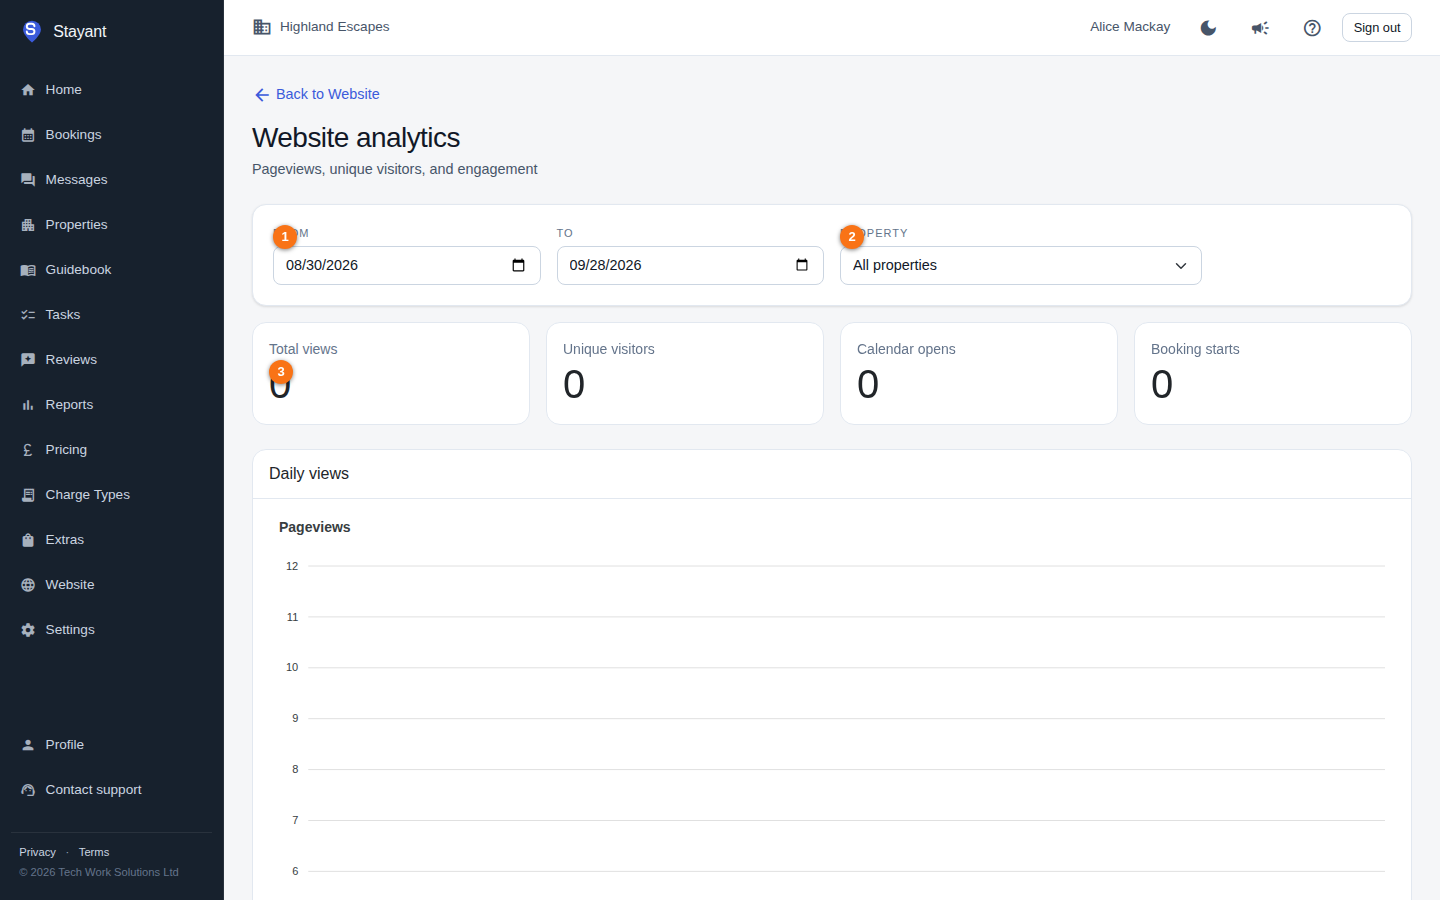
- From / To (①) — the date range. It defaults to the last 30 days.
- Property (②) — limit the figures to a single property, or leave on All properties.
The page reloads automatically when you change any filter. The summary cards sit just below the filters.
Summary cards
Four headline figures for the selected range:
- Total views — all pageviews.
- Unique visitors — distinct visitors.
- Calendar opens — how many times visitors opened a date/availability picker.
- Booking starts — how many times visitors began a booking.
Calendar opens and booking starts let you see how far visitors get toward booking, not just how many landed on the site.
Daily views chart
The Pageviews chart plots Views and Uniques per day across the selected range, so you can spot trends, spikes, and quiet periods. Below it, ranking tables break the traffic down.
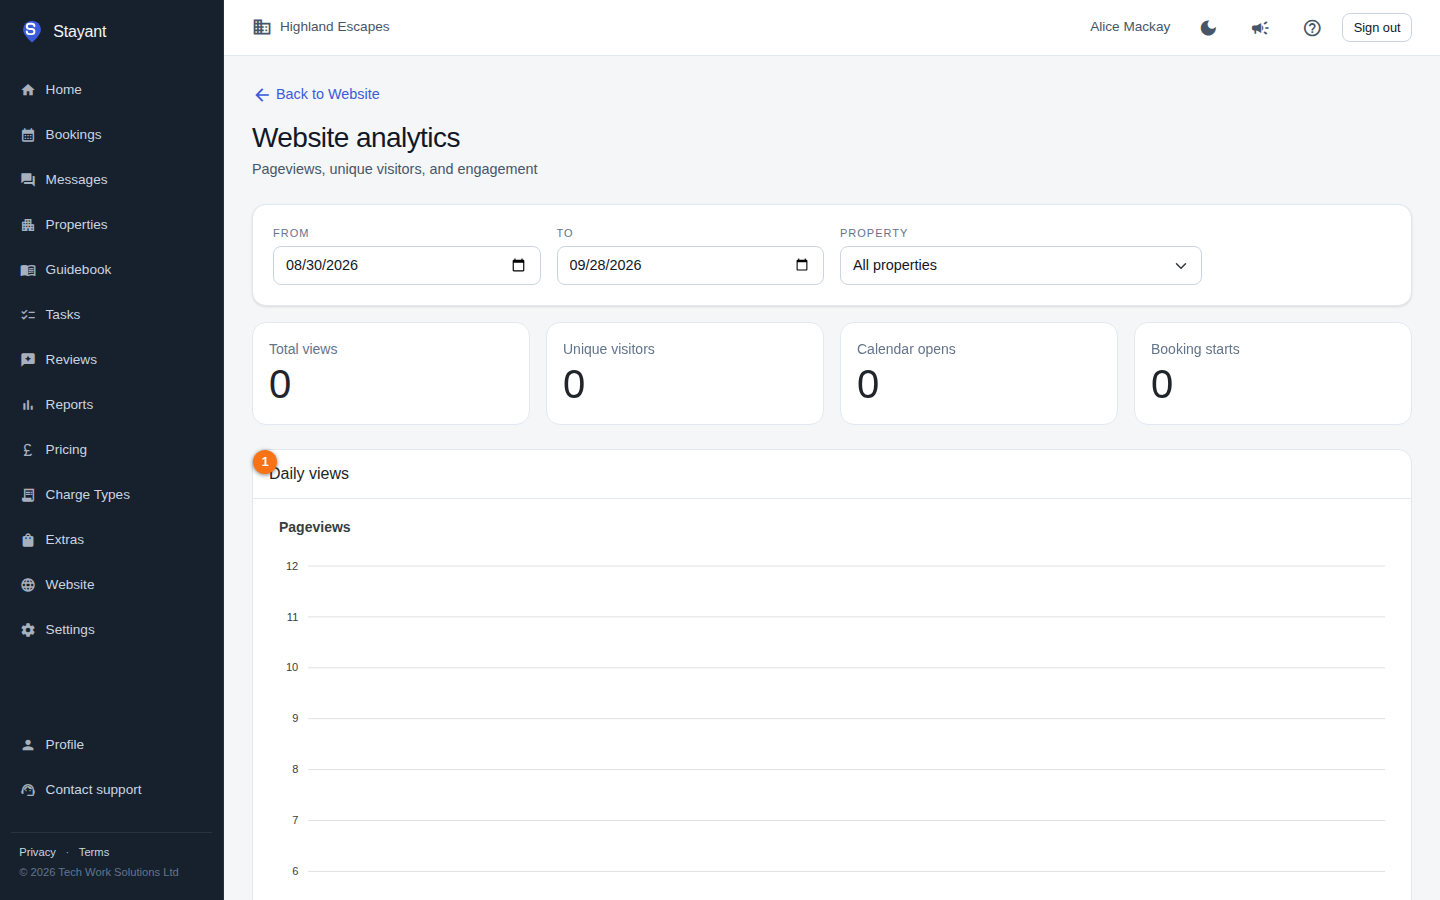
If there's no traffic in the selected range, the cards show zero and the chart and tables are empty — widen the range or check back once your site has had visitors.
Rankings
Several tables break the traffic down:
- Top pages — most-viewed pages by path.
- Top properties — most-viewed properties.
- Referrers — which sites sent visitors to you.
- Countries — visitor country.
- Devices — device class (for example desktop vs. mobile).
Campaigns
If your inbound links carry UTM tags, a Campaigns table appears listing traffic by Source, Medium, Campaign, and view count. (It's only shown when there's campaign data for the range.)
No data yet? New sites, or a date range with no traffic, show zeros. Widen the range or check back once your site has had visitors.